"Pascal-Emmanuel Gobry writes at The Week, "If you ask most people what science is, they will give you an answer that looks a lot like Aristotelian 'science' — i.e., the exact opposite of what modern science actually is.
Capital-S Science is the pursuit of capital-T Truth. And science is something that cannot possibly be understood by mere mortals. It delivers wonders. It has high priests. It has an ideology that must be obeyed. This leads us astray. Countless academic disciplines have been wrecked by professors' urges to look 'more scientific' by, like a cargo cult, adopting the externals of Baconian science (math, impenetrable jargon, peer-reviewed journals) without the substance and hoping it will produce better knowledge.
This is how you get people asserting that 'science' commands this or that public policy decision, even though with very few exceptions, almost none of the policy options we as a polity have have been tested through experiment (or can be). People think that a study that uses statistical wizardry to show correlations between two things is 'scientific' because it uses high school math and was done by someone in a university building, except that, correctly speaking, it is not.
This is how you get the phenomenon ... thinking science has made God irrelevant, even though, by definition, religion concerns the ultimate causes of things and, again, by definition, science cannot tell you about them. ... It also means that for all our bleating about 'science' we live in an astonishingly unscientific and anti-scientific society. We have plenty of anti-science people, but most of our 'pro-science' people are really pro-magic (and therefore anti-science). "
END of Article
At least for now, this holds true, the deluge of jargon in a publication is quite unwarranted, in my humble opinion. However, we are in a vicious cycle that starts with papers getting rejected because they are too "easy to understand" or are doing "simple experiments" that a 12 year old could do. The reviewers think that if it is too simple then it doesn't behoove them to publish it in their journal, "what is the big deal?" they ask.
The question of "what is the big deal?" gets answered by academics in the form of massive amounts of data generated from high-throughput experiments using expensive and cutting edge equipment followed by an application of every form of statistical testing procedure known to man. If there isn't a hypothesis then we'll let machine learning algorithms loose on the data. Something will have to bunch up, cluster or have significance somewhere. We can make up the story after we have the results in front of us.
Why do we do it? because everyone else is doing it and we won't get publications and the grants that follow them if we don't do what "everyone else is doing".
What does this lead to eventually? A flood, thousands of papers buried under thousand others. Filled with jargon, complex mathematical notation, statistical tests that were probably cherry-picked because they gave the answers that were what the investigators wanted.
Finally, you the science newbie has to enter this world, you pick a topic and are rewarded with a deluge of papers. How does one get around to reading all of this? A FeedReader helps, but only in aggregating papers from topics that you would like to read. They still have to be read by you, understood, comprehended and the methods have to be tried out to see if they work.
Then you stumble upon all the limitations of the published method when you start to work on it. It will be quite some time before you realize that the best stories that could be told using the method are already published and that you are looking at the dregs. It's too late to back out, you've spent a considerable amount of time trying to understand it and get it working and you can't abandon all the work just like that. You try to mix and match different things to see if something comes, anything at all. Your desperation colours your perception and you attempt to justify any result by bending your "unbending scientific principles". Then it becomes an exercise in torturing the data with statistical tests until you get the answer that you want, even a hint of it supported by a P-value cut-off that you chose after the the application of the statistical test and the P-values came. Then you try to wrap it up into a story and get it published.
Why bother? I don't know...maybe because we have nothing better to do.
This very long post deals with establishing the significance of your correlation. In other words, the correlation that you report, is it just a random correlation that came up or is it truly representing a linear relationship. Ideas of permutation testing and analytical ways to obtain P-values are discussed. Some simulations are shown for an appreciation of the ability of randomness to generate patterns.
TLDR-over
We've discussed the theory of correlation at length in the Nuts and Bolts post and the scientific philosophy of correlation in the Philosophy and Practicality posts. Correlation is a corner-stone method in the sciences for the detection of statistical association between two variables in an experimental study.
One thing you should very firmly hammer into your own head is that when we talk about correlation we are not talking about causality, there is absolutely no way to establish causality using correlation. When you say that two phenomena A and B are correlated you can't say that A causes B or vice-versa. You can only hypothesize that there is an association between the two phenomena, which may be a direct or indirect association, you can't know which unless you have direct evidence.
For example, you can detect a correlation between green-house gas emission levels from automobiles and the global temperature increase. Therefore you may hypothesize that there is a contribution to global warming from increased vehicular CO2 emissions. However, precisely because you can only hypothesize and can't completely prove that CO2 emissions is the only factor contributing to global warming, people are not going to believe that global warming is real.
You could probably also detect a correlation between the average number of natural disasters over a time window and global temperature change within the window. When I say natural disasters, I mean the climactic variety like hurricanes, heat waves, cold spells, flash flood rains and unexpected weather for certain places for that particular time. However, using correlation, you still can't absolutely prove that these disasters are caused by global warming, as much as you would like to say it definitively.
Also besides being unable to prove that global warming is causing all of that, correlation is also unable to prove if the relationship between global temperature rise and CO2 is a direct relationship. For example, I can say that the increased greenhouse effect and concomitant temperature rise is because of methane (a more potent greenhouse gas) being farted out by livestock, the production of which has increased to sustain the ever-growing population of meat-eaters. Now I could say that the increasing CO2 levels are just a consequence of the respiration of the increasing population and livestock and meat and feed processing technologies that consume fossil fuels therefore the correlation we observe between methane levels and global temperature is more correct and explains global warming better.
Also consider a scenario where the increased CO2 levels lead to an increase in photosynthesis and therefore an increase in the total available plant biomass for animal feeding. Consequently the population of animals grow and feed more on the plants and fart out even more methane. So the methane levels increase because of increase in CO2 and this results in increase in global warming.
Now in such a case, even though you may find a correlation between CO2 levels and global temperatures, your inference that the increase in global temperatures is because of the greenhouse effect of CO2 will not be correct because that isn't the case. Increased CO2 leads to increased plant biomass which leads to increased animal feeding and concomitant population growth and the feeding of the population generated methane which being a more potent greenhouse gas lead to global temperature increase. This is a problem of transitivity, where you cannot ascertain and differentiate using the correlation metric between direct and indirect associations. Even if your variables are working in a sequential manner to cause a particular phenomenon, applying correlation between variables will show all the variables as being highly inter-correlated.
So you can see that trying to prove a hypothesis using correlation is a dicey business, you cannot prove anything. You can only postulate an association or rather a hypothesis.
So given two sets of observations A and B, under the classical hypothesis testing format, you formulate the null hypothesis thus. You state that A and B don't have any association between them. Then you calculate the correlation between them. Although you don't know if this is a direct correlation; as in, is the situation such that A directly
influences B or A acts through X which then acts on Y which then exerts
an effect on B (transitivity).
After you've calculated the correlation you need to determine if the number that you got is significant or not. That is done using a P-value derived using a Permutation Testing procedure. Now you say that under (significance level) you reject the null hypothesis (that there is no correlation) and accept the alternative hypothesis that there is a correlation.
The Permutation Testing procedure is used in many contexts to establish the significance of a statistic. I'm not really sure why, but I think when a statistic does not have an analytic formula that describes it, then the Permutation test is used to establish a significance level. For other statistics such as the T-statistic which is analytically tractable, it is normally done using the Area Under the Curve (AUC) for the T-distribution in the case of the T-statistic and other distributions in case of other statistics.
So the Permutation procedure at the very basic level relies on permuting the data points on which the statistics have been calculated. Then it recalculates the statistics for this permuted, jumbled and by now non-sense data, The newly calculated statistics (often referred to as a null distribution) are then compared to the values with the statistics for the original non-permuted data. A P-value estimate (I don't know if calling it a P-value would be correct because at some places that I have read, this method is also used in calculating the False Discovery Rate, but then we're talking about the limits of what I know, I would happily be corrected in the comments) is then made by calculating the number of times the statistic of the randomized data went higher than that of the original data. This divided by the number of permutations gives you an estimate of the so called P-value.
Thus the Permutation test is used to calculate the significance of statistics. For correlation, the Permutation test tells you how likely it is that you got a such a nice correlation by chance. The advantage of having a significance level is (if you go by Ben Lehner's papers themed on stochasticity and noise in biological systems) that you can detect very weak correlations, which in the standard statistical methodology would have been ignored, because a correlation like 0.10 is considered insignificant in magnitude. In biology, apparently 0.6 is considered a ball-park value for a good correlation. For very weak correlations in Lehners' papers however, when you calculate the P-value for that low correlation, it turns out to be 10^-28 (10 power negative 28) or some very low value like that which makes that tiny correlation significant. Which means that the chance that you got such a weak correlation by accident is 1 in 10^-28.
So how would you pick up a weak correlation or maybe prove that a strong correlation that you got is not by chance. You can use a simple code to permute the values of a variable, to take an example which is meaningful in biological sciences, the correlation between a small number or set of values.
To make the plot thicker, let's examine the phenomenon of "spurious correlation". This is a correlation that appears when you take ratios of numbers to calculate correlation. An example of that would be the popular strategy of taking the log ratios in micro-array data analysis to calculate fold change or in the field of yeast synthetic genetics, taking a ratio of the growth rate of the mutant strain to the wild-type to examine fitness changes caused by mutation. When you measure ratios and use ratios to find correlations, you will find correlations that are actually artifact correlations that are generated because you took the ratio. When using correlations you must use the raw values to see if there are correlations and not the fold-changes.
cor(x,y) # gives a weak correlation -0.0050
plot(x,y,pch="*",main="Scatter of 2 independent Normal dist RV",col="red",xlab="Random Variable X",ylab="Random Variable Y")
cor(x,y/x) # gives a strong negative correlation of -0.717
plot(x,y/x,pch="*",main="Scatter of RV X and Y/x",col="purple",xlab="Random Variable X",ylab="Y/x")
It is easy to see why this would happen. As x changes, the value of y/x
is locked on to the change. An increase in x causes a decrease in y/x
and a decrease in x causes an increase in y. They are actually related
by the straight line equation where (y prime) is a ratio the value of
which depends on the value of y as well as x. So y' = y*(1/x) and gives a
nice negative correlation.
cor(x/z,y/z) # gives a relatively strong correlation of 0.4874412
plot(x/z,y/z,pch="*",main="Scatter of RV X/z and Y/z",col="purple",xlab="Ratio X/Z",ylab="Y/Z")
It is also easy to see how this would happen. Z is a normal random variate and whenever Z is a high value, x/z and y/z will become low and when Z is a low value x/z and y/x become high, thus introducing a positive correlation.
You can also see the effect of dividing both variables by the same set of random normal numbers. Dividing them by the same set of numbers gives you a positive correlation which is relatively strong (0.48). So you can see why taking ratios can be a problem. In biology it is a relatively common practice to divide by the total or by a particular variable. This can lead to incorrect conclusions being drawn of correlations that exist when they are actually not there and have been introduced erroneously by the normalization procedure.
Now does a permutation test prove that this correlation is not significant? Not really, since it is actually a proper correlation caused by a mathematical relation. However we can try to see how the permutation testing procedure tests for significance of correlations by testing it out on some simulated data. To ensure that the simulated data is truly random, we will generate the data using random numbers from a uniform distribution and write a program that selects a randomized set that passes the correlation criteria.
Let us try an exercise where we first make a program that tries to randomly generate data of a certain correlation that we demand from it for a specified amount of numbers. Basically we want to feed in the correlation value say 0.6 and need 10 numbers which when used to calculate correlation against 1 to 10 should give us a correlation of 0.6.
this function does precisely that. It takes a correlation value as an argument along with the length of the vector to be generated and then attempts to generate as many sets of random uniformly distributed numbers until it finds a set which exhibits the correlation that we've given as the argument. It returns the numbers that it has found along with the number of trials it took to get that set from random number draws as a list.
It isn't too hard to see by hand but you can easily see that as the length of the vector requested increases, the number of iterations taken to get to a vector that satisfies that particular value of correlation increases.
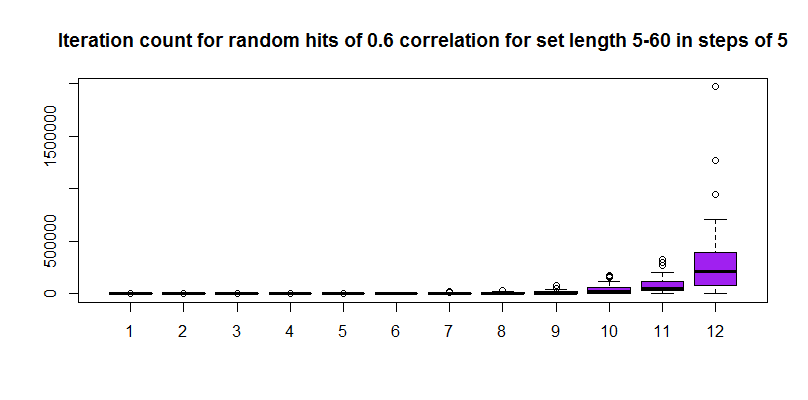
Now as another fun exercise, let us try to increase the vector length from 5 to 60 in steps of 5 (12 steps/iterations) keeping the correlation value at 0.6 and repeatedly calculate the number of random number draws that were required to get that correlation for a given length of the vector. Following that, we will plot a box plot of the number of iterations to see how much of a an effect does chance play in getting that correlation. For shorter vectors it is possible that the spread of iteration count values will be small since it is easy to stumble upon that much correlation by chance but for bigger vectors the spread should be quite large since it could take a lot of time to get that high a correlation randomly.
Now, I've written some quick and dirty code to do this that takes about half an hour to execute on an Intel Core 2 Duo, 2.1GHz, 4GB RAM Windows machine running RStudio on Windows 7. Most of the half hour is spent on the later part where high correlations have to be discovered in larger sets of numbers and therefore more iterations are needed.
corlenseq<-seq(5,60,by=5) corlist<-vector(mode="list",length=12) for(i in 1:12) { for(j in 1:50) { corlist[[i]]<-c(corlist[[i]],cor_RandGen(cor_val=0.6,len=corlenseq[i])$trial) } print(i) } uncorlist<-unlist(corlist) matuncor<-matrix(uncorlist,12,50,byrow=TRUE) boxplot(t(matuncor),col="purple",main="Iteration count for random hits of 0.6 correlation for set length 5-60 in steps of 5")
The plot in log scale looks a little better, you can see the monotonic increase in the median value of the iterations required to reach the same correlation as the set element numbers keep increasing.
I dare say that the median value of the number of iterations increases exponentially and therefore a log scaling could give a nice linear fit for the medians.
plot(corlenseq,ylist,main="Scatterplot of log2 median iterations vs. sequence length Correlation: 0.6",col="red",xlab="Sequence length",ylab="Log 2 Median iterations")
We can try a regression on log transformed medians. If the model fits well then we can presume that the log transform linearizes the medians. Now if a distribution becomes linear on log transformation then it was probably exponentially distributed to begin with, in which case we could say that the median value of the number of iterations it took to discover a vector (generated from a uniform distribution) that had a correlation of 0.6 was exponentially distributed with relation to increasing length of the vector.
Now to fit a linear model to the data, we take the y vector as the log transform of the median values of the distribution of the number of iterations taken to get a vector with that high a correlation (0.6) as the length of the random vector increased from 5 to 60 in steps of 5. The distribution of number of iterations is obtained by repeating the generation of a random vector of a particular length 50 times. The x vector is simply the lengths of the sequence of the random vector from 5 to 60 (corlenseq).
Residual standard error: 0.1845 on 10 degrees of freedom Multiple R-squared: 0.9969, Adjusted R-squared: 0.9966 F-statistic: 3180 on 1 and 10 DF, p-value: 7.456e-14
-------------------------------------------------------------------------------------------------------------------------------
So the R-squared comes to be around 0.99 so we can safely say that the time taken to generate a sequence of a particular correlation from a uniform distribution is exponentially distributed with respect to the length of the sequence. The slope of the line-fit is 0.253 and the intercept on the x-axis is 1.904. The P-value obtained from the correlation/regression - 7.456e-14 indicates that this is highly significant.
Now that is a cool thing that even I did not know. That the median time taken to find a sequence of a particular correlation randomly, varies as an exponential function of the length of the sequence.
Okay so now the post has started to acquire a mind of its own. Anyway, back to business, the post is still about establishing significance levels of correlation using permutation testing and that is exactly what we are going to do with a randomly generated vector of a certain correlation.
So we generate a vector of length 15 that has a correlation of 0.6 using our random correlation sequence generator. Then we'll permute the values to see how significant do we get the correlation to be.
plot(xvar,randcor0p6$y_var,main="15 Random Points of Correlation 0.6",col="red",xlab="1:15",ylab="Uniformly Distributed Random Numbers")
We can find a P-value for the correlation using R by using the cor.test function instead of plain ol' "cor". Note that the P-value given by cor.test is the same as the one given by the linear model fitting summary above.
Call:
 lm(formula = randcor0p6$y_var ~ xvar)

Residuals:
 Min        1Q    Median     3Q     Max
-0.46377 -0.19194 0.06573 0.19094 0.28212

Coefficients:
            Estimate Std. Error  t value Pr(>|t|)
(Intercept) 0.20685  0.13475     1.535   0.1487
xvar        0.03836  0.01482     2.588   0.0225 *
 ---
 Signif. codes: 0 ‘***’ 0.001 ‘**’ 0.01 ‘*’ 0.05 ‘.’ 0.1 ‘ ’ 1

Residual standard error: 0.248 on 13 degrees of freedom
Multiple R-squared: 0.3401, Adjusted R-squared: 0.2893
F-statistic: 6.7 on 1 and 13 DF, p-value: 0.0225
--------------------------------------------------------------------------
Now we should try to see if we can write our own variant of a permutation testing function and see if it gives P-values anywhere close to the in-built routines in R.
So we will write a quick and dirty code that permutes the values of y vector and then calculates correlation of x vector against permutations of y vector. The number of times the correlation is higher than the correlation of the un-permuted data divided by the total number of permutations is considered to pass for the P-value.
This takes about 2 minutes to execute on an 8GB,quad-core Xeon machine, (Dell Precision T5400)
cor_rand<-vector() for(i in 1:100000){ cor_rand<-c(cor_rand,cor(xvar,sample(randcor0pINR371y_var))) }
# P-value as defined as how I've seen it done for permutation testing. length(which(cor_rand>cor(xvar,randcor0pINR371y_var)))/length(cor_rand) [1] 0.01186
Hmm, interestingly, this seems to be an underestimate of the P-value compared to what we obtain from the regression/correlation tests which both seem to be using the same algorithm to estimate P-value. Could it be that the tests are obtaining the P-value by some other means? We could try building the distribution of the permuted P-values, which follow the T-distribution as I've heard and then try a rough numerical integration to see how much of the Area Under the Curve is covered until correlation of 0.6 is reached. Note that this is highly experimental and possibly wrong but then in a random blog we could try it out and learn something new, wrong things lead away to right things, eventually...
Using a density approximation, we can get a smoothed histogram. The object returned by using the density command is a list containing x and y values.
So now, I will use the trapezium rule for integration to find the area under the curve for the density curve of the randomized correlations obtained from permutation of the original data. That is 0.5 * sum of parallel sides * height, the height here is the successive difference as we step through the x-axis calculated using the R function diff which gives back a vector containing the successive differences. The sum of parallel sides is done by successive sums looping through the y-axis and adding the i and (i+1) element together until you reach the end of the y-axis and concatenating the results in a vector. plot(density(cor_rand)) dens_cor<-density(cor_rand)
height<-diff(dens_cor$x) sops<-vector() for(i in 1:(length(dens_cor$y)-1)) { sops<-c(sops,sum(dens_cor$y[c(i,i+1)])) } # Finally you just multiply the vector of differences with the vector of the successive sums and take the sum of the resultant vector and multiply it by 0.5, you should ideally get the complete area under the curve which should sum to 1 and maybe a little more because of numerical errors in the rounding off procedure. sum(sops*height)*0.5 # [1] 1.000978
# That is pretty close to 1, and now we need to find out what the area under the curve is when we integrate till the correlation of 0.58. So that would mean taking the area under the curve till 0.58. length(which(dens_cor$x<=0.58))# [1] 408 #Now the area under the curve until correlation of 0.58 is the area of the trapeziums formed by those sides till 408. sum(0.5*sops[1:408]*height[1:408]) # [1] 0.9886911
#Now the P-value is 1-AUC until the value till index 408
Um, well as it turns out, this P-value is also not close to the P-value we found using the regression/correlation in R and in fact it is closer to the P-value that we found using the Permutation testing procedure ( 0.01186). So I think we may be barking up the wrong tree here. Anyway, looking up on how R gets the P-value for its correlation I found something about a transformation called the Fisher's Z- transform. It seems that the correlation values that we get from the sampling distribution are not normally distributed except for low values of correlation and tend to be negatively skewed for higher values and applying this transformation mitigates the skewing problem.
The transformation is:
Now to do all of that neatly, we need cook up some functions, one for the
Fisher's Z transform and the second for the Trapezium integration.
A fairly simple function for the Fisher's Z-transform
For the trapezium integration, I've
just put together the code from the earlier integration code into a
function into which you can pass the randomized correlation distribution
and the threshold of correlation till which you want the AUC to be
calculated.
Now we could try applying this transform to our permuted correlation co-efficient and see if it brings the distribution to a normal distribution (trivia: such transforms are called variance stabilizing transforms). So we'll try the same thing we did earlier, i.e we start with the distribution of correlation co-efficients obtained from our permutation (cor_rand) and this time we run the Fisher's Z transform on those values and using these transformed values to estimate the Area Under the Curve again using the Trapezium rule and consequently find the P-value.
ZtranCor<-FisherZ(cor_rand)
Lets try plotting the histograms to see how things change with the transform and then we'll do an over-plotted density plot to see how the overlap is, without the R pretty printing graphs to mislead us how different the histograms look.
hist(cor_rand,col="yellow",main="Permuted Random Correlations",xlab="Correlation") hist(ZtranCor,col="purple",main="Fisher-Z-transformed Correlations",xlab="Correlation")
You have to admit though, the Z-transform has clearly made the histogram much more symmetrical
plot(density(ZtranCor),col="purple",type="l",lty=2,main="Permuted Correlations (PC's) and Z-transformed PC's density")
lines(density(cor_rand),col="red",type="l",lty=3)
So applying the transform and looking at the density plot we can see that the red curve which was the original permuted correlation distribution of values is slightly asymmetrical around the center while the purple curve which is the Fisher Z-transformed value has more or less symmetrically distributed itself around the center.
So now we execute this function TrpzInteg_AUC on the Z tranformed permuted correlation distribution values (ZtranCor to find the estimate of the P-value according to the same principle as we did before.
TrpzInteg_AUC(cor_rand,0.58) # Total AUC 1.00097847575004 # [1] 0.9886911
1-TrpzInteg_AUC(cor_rand,0.58) # Total AUC 1.00097847575004 # [1] 0.01130888
1-TrpzInteg_AUC(ZtranCor,0.58) # Total AUC 1.00097114802702 # [1] 0.02189813
So as you can see, the function behaves correctly as evidenced from it giving the same value for the non-transformed data as we calculated earlier.
The P-value estimate for the Z transformed correlation distribution(0.0219) is closer to the P-value obtained from the regression/correlation (0.0225). So we can probably say that the correlation/regression function in R uses a similar and definitely more accurate method (for the numerical integration) to give us the estimate of the P-value that it does. I'm not implying any warranties here that what we did was correct but then I could say that it was not entirely wrong.
However, the main objective of this post is not yet over, whilst we have shown how the P-values are obtained and it was a good exercise and everything, we still haven't shown the difference in the significance levels of correlation between a randomly generated vector and a real data vector that has noise added into it keeping the correlation at 0.6.
So as it turns out (proof not given). A high correlation such as 0.6 generated even through random means has just as much P-value as a perfect correlation that has been noised to 0.6. This means that a correlation of 0.6 for a vector of length 15, if it has that high a correlation, holds significance by virtue of its length. The blog post on Correlation: Philosophy and Practicality has an interesting graph which shows the decline of a perfect correlation as exponentially distributed noise is added to it. For correlations till 0.6 you can see the "cloud around the diagonal" but then as the correlation drops lower, you don't see the cloud anymore for correlations of say 0.2. At that point it pretty much looks randomized and that is where the P-value estimates are going to come in real handy. Proving that is going to take some more coding and I think this post has stretched far too long. Another post on another day, probably part 2 will have the simulations for that.
TLDR;
Random musings about Chess and Life, The title of this post is from a story by Premchand, a Hindi writer who wrote pithy, wry and direct stories about aristocracy and the life of poor men under them. Experts of Chess briefly is a story of two chess players so engrossed in games of chess that they ignore the fall of their king and his kingdom and the decimation of soldiers, later they have an argument about the game and duel each other and are both mortally wounded which is the end of the story. This post has little to do with that story though and more about the game of chess and an analogy to life.
I’ve taken to playing chess about 4 months back. I was
introduced by a friend to the game again (I used to play real lousy when I was
a kid). She is good at it and has me beat all but 2 times out of the 12 games
that we’ve played, there was a vodka fueled game where I was beaten really
badly and I can’t still say it was because I was inebriated. Then I’ve played
against the computer on Chess Titans on Windows 7. Started with Level 5, the
first game lasted two hours with plenty of Undo Moves and a reversal from a
checkmate (which according to the game statistics is counted as a loss even if
you undo), played from there and won by checkmate.
While I played I realized that early in the game there was no way to predict the future moves of
my opponent to more than 3 moves as the number of possible combinations were
insane. However, shit could get real very fast if you played fast and loose.
There is quite a bit of breathing room in the beginning and
this is when you should prepare the layout of your pieces such that they back
each other up. If you play a move just for the heck of it without an idea of
what strategy that move benefits to, then you’ve wasted your move. A move that
could tighten your offence or strengthen you defence is what you should always
be on the lookout for. Also no point
taking out the big guns early when the board is full and you have no space to
move. When the opponent is clever enough, even if you have them defended you
will lose them to the pawns, which is never a good deal. Use the Knight early
on, it can jump over pieces and on a choc-a-bloc board, it is a good way to
pick out defensive pawn positions, avoid losing the Knight if you can help it.
The computer always tries to get my Knights in exchange for its own and
considers it a fair trade. I wonder why it would do that considering it could
have used them just as well.
There are no spare moves towards the middle of the game. You
have to play everything with a purpose and exactly right keeping all the pieces
backing each other up while breaching into the enemy lines. The middle of the game is when the pieces
start going off the board and you have to start weighing your options. Would
you mind losing a Knight for saving a rook or a bishop? A pawn threatens both
your Knight and your bishop, which one do you choose? The Queen, yes you have
to save her and you could end up sacrificing quite a bit just to save her. The
computer always goes for your queen so never put it up-front with a lesser
piece defending it. Send the Rook in for an attack if you have to and then defend
the Rook with the Queen but never vice-versa because the computer will just take
your Queen and not care what it loses in return. In other scenarios you will notice
it putting its Queen head-to-head with yours and then losing its Queen to take
yours. But this is a pre-meditated calculation that assumes that a Pawn from
the computer is already half-way across the board and will reach the end of the
board and promote itself to a Queen which will make your King a sitting duck.
The end of the game is a little anti-climactic. I’m told
that towards the end, the game is predictable, so predictable that in fact the
computer stores look-up tables for the moves that can result in the fastest
check-mate. The irony is that, despite the board being largely empty, there is
not much space to run around to and you will eventually be trapped into a
corner and check-mated. Hope or horror also exists when a pawn goes over to the
other side of the board and gets promoted, mostly to Queen. That is mostly the
end, if you have just the King and other odd-end pawns, it could also be the
end for the opponent if you have a bishop or another Queen on a largely empty
board with the other King in the corner.
It seems to be quite a useful analogy for life. Play for a
strong defense, build your fundamentals. When the attack comes you should have
your defense ready otherwise it will be decimation. No point taking out the big
guns first. Play the small battles with the pawns and weaken the defense of the
enemy, then start moving in for the kill with the big guns
Recently I happened to play Level 6. It is very hard for me
and this particular game lasted 2 hours or more. I got check-mated in at least
6 different ways and kept undoing the game to see what the point of no-return
was. I played a variety of endings which were ending in check-mate. Finally I
found an undo point where it seemed I was able to smuggle my Queen bang in the
middle of enemy territory. It already had its Queen and kept troubling my King
in an oscillating check series where I stayed put in a, for the lack of a
better word, fortress of Pawns in a triangle. Then began my series of check
moves, I had my Queen backed up with a Rook and that Rook backed up with
another Rook just so that the computer Queen wouldn’t dare kill on the diagonal.
Then a sudden check by the computer Queen which came and stood right behind my
King and I took the Queen for nothing. Then there was nothing to do but to use
my Queen as soon as possible for a check-mate and that was it. I had won Level
6 for the first time ever. I had drawn it previously but a win always has a
nice warm fuzzy feeling to it. To beat a machine, well maybe not the best chess
engine but a fairly decent one.
However if I were to stretch the analogy of chess for life far
enough, is it possible that you could have made a series of moves from where
there is a point of no return? It would not be really possible to know because
I knew that until I did about 9 undoes (10 moves back more or less) I was not
able to get to the point in the game where I was able to save my power pieces
and also move in for the kill. I repeatedly lost my Rooks and the Queen in
exchanges where the computer retained a Rook, lost the Queen and managed to
promote a Pawn to Queen in the next 3 moves to give me a check-mate. Out of the
9 variants of the undo games I played (they all ended in check-mate for me
differently) only one of the games was where I managed to defend as well as
move in for the kill simultaneously.
Is it possible that I may have reached that point in life as
well, where I may have just made the best of the positions I had set out
initially but now it is just a few moves to check-mate? There is no Ctrl Z to
the moves you make in life and there is of course no going back to play a
different variant. Is the late 20’s, the middle game of academia-chess?
Have the choices that determine the closing moves of the endgame been made? I
guess I will know 5 years down the line and it will be too late to do anything
by then. All I know is that going from one day to the next, I always make sure I always
know more than what I started out with and knowledge has always been power. By a check-mate I mean the glass wall you hit up against and you just can't go higher than that, a win would be a place where you do the science you like and you live it too. Also when you realize that academic hierarchy like a lot of others in the world, is a little lop-sided, and you definitely don't want to be at the bottom of a pyramid of incompetents.
As to the question of if it
ends in a check-mate for me, your guess is just as good as mine.
In the first 2 years of my Ph.D, I happened to educate myself on how to write scientific text that can be horrifyingly obfuscating as well as technically impressive while looking scholarly enough to pass for publishable writing. Sometimes however there has been un-intended humour that comes only when you read it aloud. On the other hand, I try not to pass up the opportunity to crack a subtle joke in an institute seminar or lab meeting. So here are a couple.
For instance we had this hypothesis that exhaled breath would contain organic compounds that would help us detect the constitution of the microbiome of the gut. Basically the relative proportion of sulphur containing gases, methane and other gases would indicate what sort of bacteria were present in the gut. Being in an omics institute, we gave this collective parameter the name "gas-ome".
If that wasn't funny enough, in a proposal that I ended up writing, we had figured that different bacteria could emit the same gases so gas production alone couldn't be used to determine constitution. So we wrote, "Since gas production is degenerate among different species" to peals of laughter on recognizing the un-intended pun. By degeneracy we implied that different species could produce the same gases (like same codons being produced by different tri-nucleotides), however the social implication of that sentence wasn't clear until we wrote it and read it aloud.
My seminar jokes have been subtle. One which I never made was this one
"As much as you think that this is a scene from the movie "Kill Bill Vol I", it is not. It is a correlation of epistasis values between FBA and SGA for 97000 double knockouts."
Of course this wasn't going to go well with an audience that may not have watched the movie so I let it pass.
Another one, which I didn't crack but was there for everyone to see was a slide on using mathematical models to construct a minimal genome. See if you spot it, it is a calculus joke.
Hint: Top left corner, math expression is a joke.
Speaking of calculus jokes, here is one from my favorite (although slightly irregular) science comic at www.abstrusegoose.com
That's all for the random blog entry of the day folks!
As title says, random blog, so random entry of the day
After years of convincing myself of why I would not pay a ridiculous amount of money for reading e-books on a grey-scale screen that simulated paper I finally started to consider looking at e-book readers.
I considered looking because a friend of mine who lives in London and commutes 3 hours to get to her lab in the Imperial College told me about her Nook Reader and how it had been the handiest thing she ever bought and how she has been reading a lot now that she has books in it.
I burned a little, I like to read, but I haven't been able to. At all. From being someone who read a book a day to someone who doesn't manage even one in a month has been something that makes me very sad. My personality is altered when I stop reading I become surly, I laugh less, my punning co-efficient goes down and I become mentally lethargic.
I've been carrying my hard copy books around to lab in hopes of reading it sometime during the breaks. However when you read a book, or even carry it around, it is mis-interpreted (especially considering the colourful covers of Discworld) as wasting time. I may be wrong but the looks that are shot towards the book I'm carrying make me uneasy. Although this may have something to do with the habit I have of pulling it out during a very boring seminar or a talk when I'm trapped. But then again, why should one waste time and not make the best of it?
So the idea of a tiny paper-like screen that would let me read without strain (LCD's and PDF's are so not good for the eyes) grew on me. However
I'd already seen the Kindle with another friend in the lab and I found it a hilariously expensive device for INR6,056. A grey scale touch screen with top-side illumination for that amount of money was a little too much for my pocket. I would rather have some device with a colour screen for that amount.
I looked through E-bay to check out the prices of the Nook and that is when E-bay put a cookie on my computer that I was interested in E-book readers. Soon the Kindle and the Nook became a regular highlight on the advertisement panel on Facebook and I would see prices going down until suddenly one day it said 3500 INR. Curiosity piqued, I clicked on the link to be led to ebay where the Kobo was selling for 3500 INR and it was a touch-screen, 6inch WI-Fi and extendable memory with a micro SD card. I followed up the model on to a youtube demo video and there!, I was convinced and ordered it right away.
It has been a couple of weeks since I've had it and I have finished Monstrous Regiment by Terry Pratchett and Strange Beautiful Music by Joe Satriani on it. It is small discreet and easily read. I can pull it out anywhere and start from where I left off. The battery lasts for a week I guess. I've dropped it once on a hard asphalt track and besides some abrasion to the rubber finish it has been fine. I finally feel a little better about life and I think this might have been a good thing after all.
Here is the Kobo N905 Chess at Grandmaster level beating Microsoft Chess Titans on Level 10. Chess Titans "thought" for at least a minute before each move, meanwhile the Kobo was instantaneous and brutal in its responses. Although I should play them against each other more times to see if this was just a one off but the brutality with which the Kobo beat the computer suggests that this might not be necessary. If I happen to do it later I will post the results here.
The second thing I ended up buying was a Gaming mouse called the Dragonwar Thor. I do not game. I however anticipate a scenario when I create 3-D models that I would need a variable DPI mouse for precise rotation and control. Plus I had this 1000 rupees that I got as an honorarium for writing a book chapter. Well not really an honorarium since those guys at the publishers didn't pay up and when I asked my boss he offered to pay me from his own pocket and after taking an assurance from him that he would collect it from them I took the money from him. A crisp 1000 rupee note that lay in my wallet, crystallized, because I did not want to spend it for odds and ends like petrol and consumables. I wanted something symbolic that would remind me of my 3 week 18 hour marathon writing sessions when I sat and wrote that book chapter. So when I saw that this mouse was on a discount and retailing for 957 INR instead of the usual 1250 INR I bought it instantly, cash on delivery.
It came in a box that was as huge as the ones my LEGO's came in. Well, that was because it came with this big mouse pad as well. The cord of the mouse is covered with a weave of the kind used in cables to protect them from being burnt like the electric cord of an electric iron. The mouse is very nicely shaped and a perfect fit for my hands and the coating feels real nice. There is a dragon logo that goes RGBCMYW fading lights. The tracking light is invisible and there is a DPI switch right below the scroll wheel which allows tracking at resolutions of 800,1600,2400 and 3200 DPI. The tracking is PERFECT, I was instantly at home with the acceleration characteristics. The two buttons at the left side of the mouse by defaults play the role of back and forward buttons on the browser and in folders. Other buttons would need some settings to be done by installing the software I suppose but for now I am mighty pleased that I bought it.
Update: 05-06-2015
I found a Kobo Glo, new for cheap (6600 INR) from Ebay. It is smaller than the N905 but a little fatter. The glowlight is very evenly dispersed as has been claimed in online reviews compared to the Nook or the Kindle. Unboxing pictures towards the end!
Hmm, the text is a little more blurry presumably because of the light diffuser that makes the screen thicker as well. The touch response is fast and well the glow light is also nice, but the slight fading in the text is a little miff-inducing. Also Kobo removed Chess from the Extras! Argh, Why Kobo? It is a kick ass chess engine, beats Android, Microsoft and GNU chess effortlessly, please bring it back. They removed Chess on the latest update for the N905 as well.
Okay obviously Kobo is not going to listen to some random blog, so I found this on the Kobo forums on how to restore chess.
First of all, create a tile on the homepage launching any of the
extra present in the settings / beta features. For instance sudoku.
Be sure that you have now a tile called "sudoku" on the homepage.
Connect the kobo to the PC
For safety reason, make a backup of the file
<koboDrive>/.kobo/KoboReader.sqlite (so that you can recover it in
case something goes wrong during this procedure)
Open the file <koboDrive>/.kobo/KoboReader.sqlite with the Sqlite3 editor software you prefer (for instance SQLiteSpy for Win, but there are many free editors for any platform)
In the table "Activity", find the row with Id=sudoku, and change the value of Id=chess; save the modified DB
Disconnect the Kobo, now you should have a tile with the chess
Simplified procedure, using Sqlite3 command line tool:
Be sure that you have the sudoku tile on the homepage (if you don't have it, just play a sudoku game and it should appear)
make a backup of the file <koboDrive>/.kobo/KoboReader.sqlite
(so that you can recover it in case something goes wrong during this
procedure)
The kobo DB file (<koboDrive>/.kobo/KoboReader.sqlite) copied from Kobo
Open a shell, go the folder you created and launch this command:
Code:
sqlite3 KoboReader.sqlite < chess.sql
Copy the patched KoboReader.sqlite file back to kobo (overwriting existing file)
Disconnect kobo and you should have the chess tile on homepage
chess.sql is a text file containing the following SQL commands.
BEGIN TRANSACTION;
update activity set Id="chess" where Id="sudoku";
COMMIT;
The box highlights the fact that this is a Kobo GLO, the screen seems to gently glow against the blue beckground. Compare this to the Nook package and your heart goes a little fuzzy when you see this. Utilitarian packaging is economical and nice I suppose but those beige bricks that I got with the Redmi Note were rather dull. The Nook box is matte finish and everything but still won't give you the fuzzy feeling. Although, for all you know, it just might.
When you open the packaging the first time, the Kobo always needs to be charges and in this case, it is shown as sleeping and that you need to connect it to a computer. I don't know why Kobo is so cute about using anthropomorphic representations of the ebook reader, but then it is very cute. Connecting it to the computer begins to charge the battery. The factory state is probably set to sleep and so the battery invariably is too low to turn on the e-book reader when it gets to you.
So booting up the ebook reader, it asks for language preferences and makes you set up the Wi-Fi connection so that it can download the firmware updates and be up and running. In my case I did not know that running the firmware update was going to remove Chess from the Kobo or at least make it inaccessible unless some modifications to the sql database in the ebook reader wasn't made using command line.
Oh, they did provide a USB cable for the Kobo, also an instruction manual which again has cute pictures of the Kobo in the sun and under the moon implying that you can read it at night.
Unlike the diamond patterned finish of the N905, the GLO has diamond cuts which look graceful and the logo is stylishly emblazoned at the back. As I said earlier, it is thicker than the N905 so it will be a very tight fit inside a cover that you bought for the N905, thankfully I have a Accessorize cover that was for the Nook Touch and it fits very nicely for the Kobo GLO
So yes, that is it for the unboxing, I loved the GLO too, I think that it is really important to not have a flashy gizmo for reading, because a book and reading it was all about letting the printed text take over your mind and turn on the internal screen and animation of your mind and making everything come alive. It is quite hard to do it when your device keeps going, "ooh, look there flashy button, press it right away!". The ebook readers are an austere form of technology, you can say they are steampunk versions of ARM based tablets. No distractions, very long battery life and just plain text on a plain screen that looks like paper.
Anyway, I had to see if the Kobo chess engine was really good at playing itself. So the Kobo GLO played White and the Kobo N905 played Black at Grandmaster level.
It was a tough and evenly played game, the pieces were all lost in the same order, it lasted 72 moves. Most other chess engines do not last over 40 moves against the Kobo chess engine. So evidently a close match and finally White queened and checkmated Black, the only reason for which I see is that, White gets to move first and therefore has a slight advantage.