Saturday 7 November 2015

Focus, on things that will matter.


So I have a side venture now, I am going to be building pedals.
I was out looking for electronic components in Chandni Chowk which in India is pretty much the go to place for all electronics, discrete or assembled.

Shop 595 is for components when you want to build projects, shop 611 is for all kinds of integrated circuits and rare semiconductors that you cannot find in 595.

So I was in 611 looking for 2N7000s (low voltage FET), TL082's (dual op-amp). If you can't tell already, I am trying my hands on building a FullTone OCD overdrive pedal as my pilot pedal project. I have scavenged an MXR Dist+ that I couldn't use much, for the enclosure, jacks and foot-switch.

So the shop has this neat system of inventory with stacks of boxes that have labels of the IC numbers that I can read over the counter.

I saw the TLC series and the TC series and my eyes went through the sticker on that box until I saw TC4420 which I had really wanted a decade ago when I was obsessing over Solid State Tesla Coils.
I suddenly just wanted to buy it and asked for the price. However, something happened at the moment and I realized that even if I bought it, I probably wouldn't be building a SSTC any time soon. The time has come for me to focus on doing the right thing at the right time, Right now, I really have to build pedals, nothing else should be taking my time away except my academic obligations maybe.

So yes, focus, it is important. I have someone who is in the know of business and wants me to work the way he knows that it will work. So I will be building guitar pedals, acoustic guitar pickups and vacuum tube amplifiers. This is important if I want to have a business, to make things that sell.

Let's get the Fulltone OCD going.

Tuesday 5 May 2015

Audio Technika

 A friend of mine from the UK got me replacement 6V6GT tubes for my Laney Cub 8. It had been lying un-used for a year since the heater filament on the old tube, a Ruby 6V6, broke (I found that out by getting the schematic PDF, identifying the heater pins and using a multimeter to check continuity, yay!).

 Replacement tubes aren't readily available in India and I don't have a credit card that allows me to order online. So, I offered to pay and she being the nicest person I know in the universe got me two sets of tubes, one of which she paid for. A pair of Westinghouse tubes which sound all thick, twangy and juicy and chime bellishly when over-driven and break up very musically when plucking intensity of the strings is varied. The other set of tubes were Russian Military NOS (New Old Stock) tubes that sound like they would be good for metal. They don't break up the way the Westinghouse does and sound good on power chords and overdrive quite musically when cranked up. By now you may realize the musings of an analogue gear maniac, yes I own a Laney Cub 10 as well, two of the cheapest tube amplifiers that you can get here in India and I got them for a real good deal by buying old stock from an online retailer when the dollar shot up to 65 INR. I knew that the rupee wouldn't come down for quite some time so I went on a shopping spree buying everything at the old rates, a lot of people had the same idea I guess, so many times I would hit a blank after ordering something only to have it canceled and have the seller offer me the same thing at the revised dollar prices, lost at least two Boss NS-2 Noise Suppressors because of this.

Tube amplifiers by themselves are capable of nice tones with fat Strats, I have a Washburn X10 which is about a decade old now, my very first guitar. On a solid state I would be hard-pressed to hear the difference between the middle position single pickup versus the bridge humbucker, but with the Laney, the difference is clear as crystal, the tonal characteristic of each pickup is different and colours the sound differently depending on the position and this is very clearly audible and not just a golden ears phenomenon.

No analogue setup is complete without discrete pedals and to this end I am guilty of being partial to BOSS pedals.

 You will see the odd Digitech, EHX, and NUX pedals, but every other pedal is a BOSS. 3 different kinds of Distortion pedals, the Distortion DS-1, Blues Driver BD-2 and the Metal Zone MT-2.Three distortion pedals that cover completely different areas of the distortion spectrum despite their user manuals providing overlapping settings for Crunch, Overdrive and Distortion. The MT-2 can be made to scream or growl by putting the Equalizer GE-7 after it and scooping out the frequencies.

The DS-1 is one of those ice-pick sounding distortion pedals, going into an amplifier which is a little hi-fidelity can result in a sharp bite to the sound, can be very unpleasant. But going into a tube amplifier you can make it sing. The BD-2 on the other hand is amazingly versatile, you get your standard blues trip and you can also get this heavy crunch to a deep growling chug-chug rich in harmonics, very pleasant and heavy and could be used in a lighter metal setting.

The Digitech MultiVoice Chorus is one of those pedals I bought after I heard the expression, "lush chorus as thick as week old coffee on your desk". It is really lush. However if you are the MN3007 BBD chip fan this will sound artificial to you. The chorus enables you to add "Voices", which means that you can add more than one chorus sound going all the way up to 16 chorus sounds added to the dry signal. Think liquid-shimmer-warble-underwater and some more. Can sound metallic if overdone but it is a chorus pedal with just more than a Rate and Depth knob. Level helps you adjust the signal output.

The Stereo Memory Man with Hazarai (SMMH) is my first ElectroHarmonix (EHX) Pedal. I'd always dreamed of getting the EHX POG2 or the HOG2 for those organ like sounds but as it turns out, the SMMH was the first EHX to hit my collection. I also wanted the EHX 2880 multi-track recording looper but they shut down the manufacture and replaced it with something else even before that pedal ever reached India.

The SMMH is a delay pedal with a looper and a lot of "bells and whistles", the "Hazarai"- a pseudo Yiddish word for it apparently. So here's in the deal, this delay pedal gives you more controls than the average delay pedal. Normally you have Level, Feedback, Delay adjust, Delay Type/Length. The SMMH on the other hand has Blend, Decay, Filter, Repeats, Delay and Hazarai. So the main difference from a normal delay pedal here is that the Decay and Repeats are normally combined in the knob labeled Feedback in a standard delay pedal. You want the notes to decay fast you turn the Feedback down, you want them to stay longer you turn Feedback up. However, this doesn't make for any interesting effects on a delay pedal unless you count weird oscillations or Wall of Sound effects that are barely just spilling into the oscillation zone.

On the SMMH however, this separation allows you to create flanging effects, strange motorcycle type sounds. Filter adjusts the tonal characteristics of the delayed signal allowing you to change the fidelity of the signal to make it lo-fi if you want so that the delay sounds warmer and analog. Delay does what it says and Blend is the same as the Mix or Level knob for a delay pedal. The Hazarai knob allows you to switch between the various delay modes that are available.

Here are the guts of the SMMH, I bought this from a friend so while it belonged to him, the footswitch began to malfunction a bit because the brass contacts got oxidized, I opened up the switch, oiled and cleaned the contacts and put it back together, it worked like a charm after that. I took this photo then, it's 12MP so zoom in for a closer look.


The coolest thing is the looping function followed by the ability to tap tempo over the loop to change its beat, the loop is auto-quantized which is pretty cool and also if you turn the Delay knob while looping you can speed up or slow down the loop and create some amazing variations of your loop that can give you musical ideas on how to change the pitch of your lick to effect a certain mood.


The Nux Core is a modulation pedal that I bought because it was a good deal in getting all the modulation effects under one pedal. Flanger, Phaser, Vibrato, Uni-Vibe, Chorus, the works. all digital emulation but then since I need them only occasionally I don't mind having an emulation.

Interestingly there is this Indian company called Stranger which produces effect pedals. I happen to have a Chorus a friend left with me. I had heard forklore about how the Chorus was a copy of the Boss CE-2 which used the MN3007 BBD chips clocked with the MN3101chips for a very warm sounding analog chorus. So when I opened it up, there, they were, the chips and the classic JRC 4558 op-amps which I'm presuming are used in the input buffers and filters. Check it out.


 I'm really not one to wax lyrical about classic NOS chips and how they sound much better than the "stuff these days". But you know what, all of that reading about the "warmth of analog" and the search for the Holy  Grail of an op-amp chip or a germanium transistor that isn't available anymore and gives you the classic  warm sound (never mind how you play). That reading really rubs off on you, you start seeking out old pedals to see if there is any mojo to the analog gear. Of course all of this comes at heavy cost to your wallet and little improvement to your playing skills. But, I was a digital effects user and used a Zoom G2.1U admittedly not the best of the digital series and after which I moved to tube amplifiers and analog pedals, haven't looked back after that. Although I am a bedroom player and not a gigging musician so my experience may be irrelevant to you. One would have to wonder about the practicality of taking all the pedals to a gig or just taking an effects pedal that contains all the effects in one handy package.

However, I can tell that my guitar sounds versatile through a tube amplifier and not much through a solid-state. It could be the way the impedances of the pickups react with the preamplifier to give different frequency responses or something else. But the guitar does sound more alive through the tube amplifier. I wouldn't probably appropriate the same mojo to pedals though. Some pedals sound bad for sure, certain digital emulations can sound very clangy and metallic or brittle and certain analog sounds are mushy enough to feel good when in the mix. As always, it is a combination of your guitar, pedals and amplifier. I find that changing any one of these suitably give me a tone that makes me feel like I'm in love with it and inspires me to keep playing and coming up with inventive licks that I never knew I had in my fingers or in my heart.

Ideally that is the kind of tone you are searching for and I have found tones like that in my Laney Cub 8 as well as my Hartke G 10. So I won't vouch for one over the other but I would say that a tube amplifier can really bring out the sound of the guitar and make you appreciate it much more.

This is a speaker cabinet my dad bought in 1989. It has an 8 inch 20W RMS Philips driver. He bought this with the Philips AW739 cassette deck. There are two of these.

So I'd been using them with a Class AB amplifier that I bought, but then one of the speakers blew out and the other ripped at the cone circumference. So I decided there had to be another speaker to share the load of the first one. I'd bought these JBL speakers for the car but they turned out to be a little bigger than what I needed at 6.5 inches. Besides the main driver, they feature a mid-range and a titanium tweeter mounted in front of the speaker, so they are 3-way speakers with internal crossover in that sense.

Fitting the speakers in the cabinet ended up taking the longest time where I'd opened up all the planks in the cabinet and marked the circumference out on the wood only to find that my largest circular saw was about a quarter of an inch shorter on the diameter. I drilled it anyway thinking I'd file away the rest to make the hole bigger to fit. So the round cutaway was done in about 30 minutes but the filing took me about 2 months because it was incredibly slow to file them away and I wasn't able to do them evenly. The perfect tool for the job was a wood rasp but I did not have one and a combination of laziness and lack of time made sure I could never get around to a hardware store.

Finally one day, feeling really low because I had not achieved anything I felt was particularly worthwhile in a long time, I stopped at a hardware store on my way home from the institute. I asked for a rasp and was handed a file, it took me a drawing and a lot of description until they produced a rasp with nice jagged teeth which was slightly encrusted with natural corrosion from the bottom of this huge pile of files they had. It did not have a handle and it was for 50 INR, I asked for a handle and they said that would be an addition 40 INR. For the life of me I couldn't figure out why they wouldn't just sell the darn thing assembled for 90 INR. I paid up, wrapped it in a newspaper thickly and put it into my bag and made my way home.

Reached and thought I'd do it later and suddenly found myself at work widening away the hole, the rasp was much faster than the file and within 15 minutes I had filed away a quarter inch from the circumference to the circle I had marked originally for the dimensions. When I got to the end, I swapped with the file because I wanted a smoother surface. The rasp was practically extracting chips of wood at a time.

Then I marked the holes for the speaker mounting, drilled away and fit the speaker and the grille, soldered the wires in parallel to both the speakers, taking care to make sure that phase of both the speakers were accurate. Put the planks back together, tucked the cloth grille and assembled the speaker cabinet. Repeated the same for the other speaker and I was done. Time for testing!

You can see both the speakers through the cloth grille, the Philips is a paper cone and the JBL is a plastic cone. There is an additional metal grille cover that goes on top of the JBL GT6-S366, this cover prevents random knocks from breaking the mid-range,tweeter assembly which is mounted on the center of the speaker, off. There is a tiny magnetic JBL logo towards the bottom that snaps to the grille when you are done putting it together.


The amplifier I have is a V12 Class AB amplifier which I suspect is a chinese knockoff of the original Alpine V12 amplifier. It promises 160W RMS into 4 channels at 2 Ohms (that is about 640W RMS!). The speakers in the Philips were originally 8 Ohms, but during the repair I suspect the coils were changed to 4 Ohms, the JBL's were also rated at 4 Ohms, so I expect that in parallel configuration the resistance was 2 Ohms and I measured that with a multimeter to verify, it was correctly so.

So the V12 needs to be powered by a 12V battery and triggered with a voltage to the remote wire. I used a Corsair VS 650 SMPS and plugged in the 12V line to the V12 and connected the remote wire to +12. The amplifier turned on and I sent in the first strains of music using a Behringer Xenyx302USB plugged into my computer.

Blown away! crisp bass coming from the original 8 inch drivers along with mid-range being divided quite evenly among the two speakers. The JBL has a plastic cone compared to the stiff paper cone of the Philips. The titanium tweeters made for some sweet treble which didn't have excessive bite.

I started to get the feeling that I might not need to pull out my JBL GTX-1250 subwoofer for bass because it might just get too much. But I soon found that at low volumes I wasn't getting the thump I wanted. Playing it at higher volumes obviously disturbs parents and neighbours, not necessarily in that order.

So out came the sub-woofer from the rucksack. The sub-woofer has to be a bridged connection across Channels 3 and 4. Bridging in amplifiers is a certain topology that allows you to connect two amplifier channels in series so that you get more power out of them. The subwoofer is about 12 inches in diameter and specifies an RMS power of about 310W. It can obviously thunder but I wanted it to just to balance out the bass output at lower volumes. Which it did perfectly, kicking in at low volumes just enough to balance the bass out at the exact intensity of the mid-range and the treble.

Honestly, I'm no scientific designer of speakers or anything but these sound very good to me. They are probably not transparent and reflect my bias for the low end, but I'm happy! I also played my guitar in Direct Injection style and it was wonderful to hear how the low E string got its push from the subwoofer and the upper registers went to the mid-range and the tweeters. Chords sound clean and dry, obviously no colouration like guitar amplifiers do. I think it was a good result for all the DIY work that went into it. The speakers are mounted up on the walls in my room.

Added: 14-Sep-2015


We have new members in the family, meet the Boss SuperOverDrive SD-1 and the Mellowtone Singing Tree overdrive which is a boutique sort of pedal with very crunchy to gnarly overdrive tones that can almost be fuzzy. Also meet the Nux Time Core is a delay pedal that is sitting in that channel for delays in soloing. Strangely I hear a relay click when the Time Core is turned on which probably means that it implements True Bypass switching using a relay. 

Tuesday 14 April 2015

Principal Components Analysis: making omelettes without breaking ellipsoids

One of the ways to represent the results of an experiment with one user-controlled variable (independent variable) and another variable that supposedly changes with the changes in the independent variable (the dependent variable), is the scatter-plot. If the data-points are uncorrelated they will be dispersed equally across four corners of the plot and if they are correlated they will be along the diagonal. It is called positive correlation when they are along the rising diagonal and negative correlation when they are on the falling diagonal.

However, this data is of the co-ordinate form (x,y) and therefore two dimensional. Now suppose that we are looking at more than one dependent variable. Then it could be that our data will become 3 dimensional with the co-ordinates of (x,y,z). Now 3-D data can still be observed by plotting (x,y) & (x,z) but if there are more dimensions like 4,7 or 12 you can see that it will become hard to plot and observe. In that case we will be looking for a scatterplot that shows the variation in the data but it will be harder to find.

Enter Principal Components Analysis, PCA needs you to format/formalize your data as a matrix where the columns represent the various dependent variables. Each column represents a dimension in space, so each of your rows is a point in N dimensional space where N is the number of columns/variables in the matrix.

So the first step to doing a PCA is to center your data using the mean. Then you calculate the covariance matrix of this mean centered data and then find the eigen-values and the corresponding eigenvectors and sort the eigenvectors by the magnitude of their eigen-values. These eigenvectors represent the projection of the data-points into a lower dimensional space that preserves the maximum amount of variation in the data. The magnitude of the eigenvalues with respect to the total represents the proportion of variance explained by rotating the data by the corresponding eigenvector.


So, yeah, that is the explanation every text on PCA gives you, so what am I telling differently here?

A couple of things, first, mean centering the data would bring the data to the origin of the co-ordinate system with the mean being the origin instead of the data-points being arbitrarily located at one corner of the graph. So, geometrically, when mean-centered, all of your observations are defined in values which when squared and added and then square-rooted would represent their Euclidean distance from the origin.

Next, what does it mean to calculate the co-variance matrix?.

Co-variance is a measure of how two or more set of data-points/random variables vary with each other. If you go through the post on Correlation: Nuts, Bolts and an Exploded view, you will understand how co-variance measures, (in an un-normalized fashion), how much two random variables co-vary.

Variance is also called the second moment, so co-variance would be the second moment for two sets of data-points and would measure how fast the two data-points vary with respect to each other. Doesn't that sound like something that is familiar from calculus? the rate of change of a variable is expressed as the derivative isn't it? So is the co-variance matrix some sort of a matrix of derivatives?. Turns out that moments of data are analogous to the concept of derivatives of functions.


To make matters more fun, we come to the problem of computing eigenvalues and eigenvectors. The eigenvectors of a certain matrix are vectors that when multiplied with the matrix are not changed (i.e their co-ordinates do not change, they don't get rotated or translated) only their length changes. Length of a vector, assuming that we have mean-centered everything before this computation step, is simply the Euclidean distance from the origin (0,0,0...) which would be the square-root of the sum of squares of the co-ordinates. So length is a scalar quantity and the eigenvector is simply scaled by another scalar when you multiply the matrix with the eigenvector. In this case that particular scalar is the eigenvalues. So every eigenvector has its corresponding eigenvalue which indicates, how much the length of that vector would change when multiplied by the matrix. 


So we calculate something called the characteristic polynomial for the covariance matrix with the yet-to-be-computed eigenvalues subtracted from the diagonal entries. The characteristic polynomial is basically the determinant of this matrix.


After we have the characteristic polynomial, we equate it to zero and calculate the eigenvalues. For those of you familiar with calculus, finding the first derivative and equating to zero and solving for the values is familiar as the computation of the maxima of a function. In this case, our function is the characteristic polynomial and the eigenvalues are simply the roots of that polynomial which maximize that function. Since the co-variance matrix is positive definite, there exists only a single, unique, minimum (if you flip the function by multiplying everything by -1, it becomes a maximum) and the eigen-values are defined at those points.

So what is the determinant here? according to geometrical intuition, determinants are areas (in higher dimensions, volumes) of the space spanned by the vectors of the matrix for which the determinant is being calculated. So, here, the determinant of the characteristic polynomial gives us a measure of the volume spanned by the vectors of the co-variance matrix and the eigenvalues give us the values by which each vector is shifted along each axes to maximize the volume spanned by the set of vectors.


So the eigenvectors which correspond to these eigenvalues are co-ordinates along which the proportion of scaling described by the corresponding eigenvalue is observed for the data.

So when you rotate the data such that they lie along these eigenvectors, they will describe the maximum about of variance in them. Essentially, the data points are rotated to a new set of co-ordinates  where the maximum amount of variation present in the data is represented.

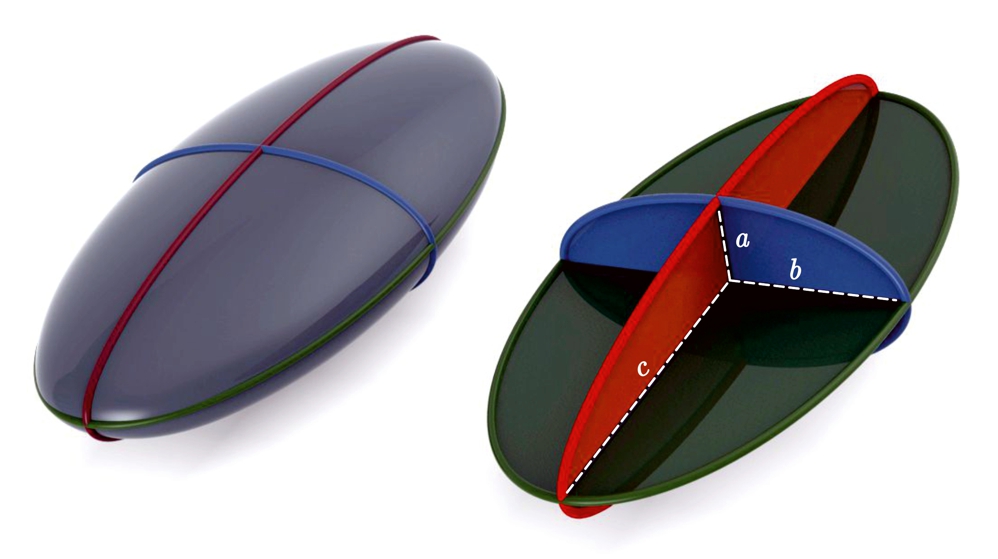
For intuitiveness, let's imagine that our data is an ellipsoid/egg, not a circle/sphere, so that it has two directions which have different variations/spreads. Later we will generalize it to a scalene ellipsoid which looks more like a bar of soap and has different spreads across different axes.

So ideally, if PCA is able to find the directions with the maximum variance then, for an ellipse it should find the major and minor semi-axes.

Now for some practical programming exercises.

Various texts on PCA will tell you that doing a PCA on your data rotates the data-points in such a way that you are able to visualize the maximum amount of variance in your data. So for now to make this intuitive, let us put together a data-set of 3 dimensions (because 2-dimensions can be visualized using a scatterplot). So we will be making a 3-D ellipse, often called an ellipsoid of data-points such that we can see it using an interactive 3-D plot that is available in R under the package rgl (installation instructions in the post on Brownian motion).

So we start with formulating a function for an ellipsoid. A 3-D ellipsoid would have co-ordinates (x,y,z) and the axes would be (a,b,c). The equation would be.
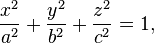


{x^2 \over a^2}+{y^2 \over b^2}+{z^2 \over c^2}=1,

in R we type

ellipsoid<-function(xyz,abc,radius){
ellipse<-(xyz[,1]^2/abc[1]^2)+(xyz[,2]^2/abc[2]^2)+(xyz[,3]^2/abc[3]^2)
ellipsis<-which(ellipse<=radius)
return(xyz[ellipsis,])
}

So R newbies, this function uses a few shortcuts now. I'm passing the data as a matrix and indexing it in the body of the function to extract the respective (x,y,z) co-ordinates and sending the semi-axes as a vector of numbers. Compared to earlier posts this will be a little more of brevity. However the meaning stays the same and you will see it soon enough.

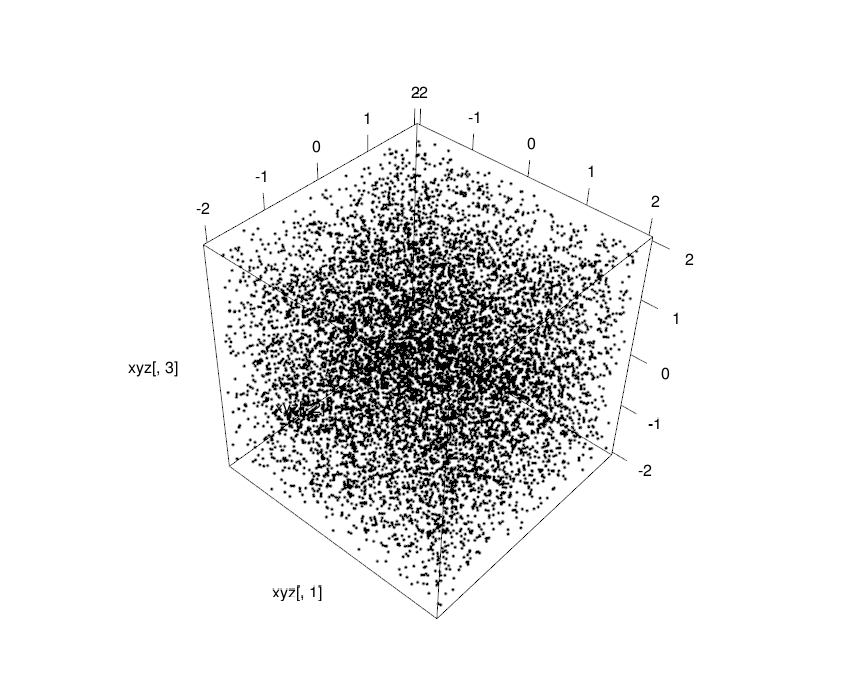
So here is what are going to do, we start with a box peppered with points every where uniformly, that will be our random cloud of data.

library(rgl)
xyz<-matrix(runif(30000,-2,2),10000,3)
plot3d(xyz[,1],xyz[,2],xyz[,3])


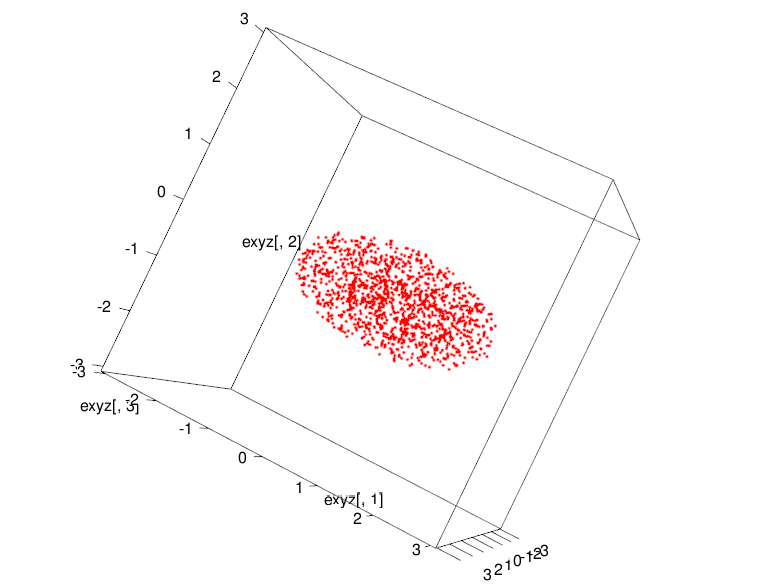
Then we transform it into an ellipsoid of points using the function ellipsoid which we just wrote. This ellipsoid will be our high-dimensional data. Although it is not really high-dimensional and you can very well use scatterplots to see what is happening but for the sake of argument, let us say that it is high-dimensional and we are unable to view it.


exyz<-ellipsoid(xyz,abc=c(2,1,1),radius=1)
plot3d(exyz[,1],exyz[,2],exyz[,3],xlim=c(-3,3),ylim=c(-3,3),zlim=c(-3,3),col="red")


Now with this ellipsoidal cloud of points we will perform a principal components analysis. Since PCA gives us vectors called Principal Components which describe the greatest amount of variance in the data, for an ellipse the PC's would be the semi-axes. There after we will see that tweaking the length of the semi-axes (the values of a,b & c) will show their reflection in the amount of variance in the principal components.

So first I'll just briefly talk about ellipsoids, ellipsoids can have different shapes depending on the length of the semi-axes (a,b,c). As a special case, if all three semi-axes are of the same length (1,1,1) then the ellipsoid actually becomes a sphere.If one of them is about twice as long as the other two which are equal (2,1,1) then the ellipsoid becomes egg-shaped and is called a prolate spheroid, similarly it could become an egg which is wider than it is tall and that would be an oblate spheroid which is what the Earth is like, being squashed at the Poles. A rare case is when a>b>c, there is a convention of ordering in the semi-axes, so a is the semi-axes along x, b is along y and c is along z. That rare case looks like a computer mouse and is called a tri-axial or scalene ellipse.

 
Code for scalene ellipsoid:
plot3d(ellipsoid(xyz,abc=c(1,2,3),radius=0.5),xlim=c(-3,3),ylim=c(-3,3),zlim=c(-3,3),col="red")


Why am I talking about ellipses here? because data with multiple dependent variables forms an ellipsoid in higher dimensions. Or at least the limiting case of normally distributed data would be an ellipse (oblate,prolate,spherical or scalene), because uniformly scattered points would have to be uniformly distributed if they are to be seen as evenly spread throughout the co-ordinates, which your data wouldn't be unless it was just random noise.

So knowing from theory that PCA rotates the data in such a way that we can see maximum variation, for an ellipsoid, the directions for maximum variation would be along the semi-axes right?

We needed to know the different kinds of ellipses and the above information will help us track how the variance described by the Principal Components change when we modify the length of the axes. So here we also need a convenient function to be able to tweak the parameters quickly and view them as well. Let us, for a short time, be really horrible programmers and make a function that displays the shape of the ellipsoid or does a principal components analysis with the relevant plots depending on what we feel we need to see.

Ellipsoid3D_PCA<-function(xyz,abc,radius,mode=NULL){
require(rgl)

pointcloud<-ellipsoid(xyz,abc,radius)

if(mode=="pcaPCplot"){
trypca<-princomp(pointcloud)
print(trypca)
biplot(trypca,cex=0.4)
}

if(mode=="3dPlot"){
plot3d(pointcloud[,1],pointcloud[,2],pointcloud[,3],xlim=c(-3,3),ylim=c(-3,3),zlim=c(-3,3))
}

if(length(mode)==0)
{
print("Mode is missing : use 3dPlot or pcaPCplot")
}

}

Now this function simplifies a lot of typing and helps you to quickly modify parameters by repeating the commands using the UP Arrow key.

 Ellipsoid3D_PCA(xyz,abc=c(2,1,1),1,mode="pcaPCplot")

So PCA doesn't really care what length you chose for the semi-axes, it will always find the longest semi-axes as the first PC and the second longest as the second PC and the third longest semi-axes as the third PC. PCA will give you the same result even if you re-ordered the axes sizes like this.

Ellipsoid3D_PCA(xyz,abc=c(1,1,2),1,mode="pcaPCplot")


So the semi axes are like an averaging line which runs through the cloud of points and spans the maximum amount of points of the ellipsoid as possible along each of the  independent co-ordinates x,y and z. By independent I mean that the x,y and z co-ordinates cannot be expressed in terms of each other. There is no linear relationship that would allow you to express one axis in terms of one or more of the others. This is a concept called orthogonality.

Principal Components are orthogonal to each other and are made up of linear combinations of the variables in the matrix (the columns). So, a principal component tells you how much of the variance that you see in your data can be described in terms of orthogonal axes that are composed of linear combinations of the variables in your experiment. So, in terms of biology, if one of your experiments is very noisy and has data scattered throughout the co-ordinates, it would contribute considerably to the principal components.

Now PCA is also said to be a method for dimensionality reduction. So you can reduce the number of dimensions in your data while retaining the maximum amount of variation that defines your data. So how would that work, what does dimensionality reduction mean?

Dimensionality here would be the number of variables in your experiment. So generally experiments are represented in the form of a numeric matrix where the rows represent the entities being experimented and observed and the columns represent the different perturbations that have been applied. Here is where the question that you are asking becomes important. So is your question, "what are the experiments which describe the maximum amount of variance in my data?" or is it, "what are the entities which describe the maximum amount of variance in my data?".

If it is the first, then your dimensions are "experiments", else you have to take the transpose of your matrix such that "experiments" comes on the rows and "entities" come on the columns.

So how can you reduce dimensionality, you may ask, because obviously, the number of experiments that we have done is fixed, you may say "I'm not going to remove the results of one experiment that I did just so that my data becomes manageable. I want all my experiments to be factored in!".

What if I told you that maybe, a bunch of experiments that you did, despite all the hard work that went into them, do not contribute anything in terms of new results. Not philosophically! but actually they do not give any new numbers that might be statistically analyzed to get interesting results because they all say the same thing numerically speaking, they are collinear and therefore one of them describes the variation just as well as the other of the bunch do.

"Well, I'm still not throwing them out!", you say and rightly so, we don't need to throw them out, we can still make another column/experiment that combines the bunch of these columns into one column that contains all the data in the bunch but expressed as a linear weighted sum of the individual experiments of the bunch.

This weighting of the experiments allows you to retain all the experiments and their results but you end up re-weighting them in terms of the amount of information that they contribute to your data. Information here is defined as variance, so coming from where we considered variance to be noise in experiments, we now consider variance to be a sign that something is happening in our data which we can't directly quantify in a numerical, pair-wise comparison but we can see that it changes the amount of variation observed in the data. So the variance observed is considered to be a result of the perturbation.

So, the eigen-vectors that you get after the PCA decomposition are a mapping of your original data matrix into a sub-space with lower amount of dimensions where the number of dimensions have been reduced by taking dimensions which are linear combinations of the original dimensions. So you have managed to express most of the significant variation in your data in the form of a matrix which is much smaller than what you started out with. This is what it means when it is said that PCA is used for dimensionality reduction.

We'll see a more hands-on approach to PCA in the next installment to this post. Mull over everything you've seen and learned here and try to check out other resources on PCA to see if you've gained a better understanding of what is going on, Also try out functions other than ellipsoids and see how PCA behaves for them. Increase the number of dimensions so that you now only have a 3-D projection of say a 7-D data-set. Play with parameters, axes values and have fun.

Saturday 7 March 2015

Chicken Soup for the Ph.D soul or Hitchhikers Guide to the Ph.D


The title is taken from a popular series of books that help different classes of people deal with different sad things in their life. So you have Chicken Soup for the Christian Soul or Chicken Soup for the Teenage Soul and over 103 other titles if you are interested. Obviously, it is much more enriching to just save money and skip these titles and buy yourself a copy of the ultimate Hitchhikers Guide to the Galaxy by Douglas Adams and if you aren't too puritanical and hated what happened to Arthur, buy Part 6 of 3 "And Another Thing" H2G2 by Eoin Colfer who continues where Douglas left off without ruining the effect and effectively executing a near perfect ghost-write.

However this post isn't really about the books, which will probably merit a post of their own but rather a survey of my mostly incomplete surmise of what it means to be in a Ph.D and how it should have ideally been (although every Ph.D may have a different opinion on this). Of course when I write all of this, I write it out of personal experience with nary an exaggeration. I'm at that stage in a Ph.D where I know that I enjoy thinking unfettered but I'm dismal about how reality fails to keep pace with imagination where I work. Working in computational biology allows me to simulate things which I couldn't using pen or paper or my imagination. I've learned a lot more about philosophy and the empirical nature of cutting edge science from this field.

The rant that follows came out of my experience of being a teaching assistant in a class teaching kids how to use the Arduino to create novel diagnostic devices, which is the mandate of the institute that I work in. We had one batch which was more or less successful in coming up with ideas which whilst not exactly being novel, were quite good in what they were able to achieve for the price with commercial devices being as much as 100 times more expensive. However pedagogy, of which I have no professional experience, to me dictates that setting a restriction on the class of devices that can be made can be unnecessarily constraining the imagination of kids.

They end up having to think of something new in an almost saturated field which naturally leads to more derivative work with incremental improvements. It is quite similar to being an apprentice to a carpenter and making a cupboard as the final test of your ability (ref. Ph.D supervisor, graduate student and Thesis). The debate of whether the system is broken or not could go on forever so we stop there.

It is true that science proceeds incrementally most of the time which only a few jumps, few and far in between that advance a new field. That field is eventually saturated again and the cycle repeats.

There is a huge emphasis on not re-doing work that has already been done unless there is some novelty. While the perspective makes sense, somehow I feel that we are robbing the kids of the rich experience of being able to think through the whole process of scientific discovery afresh. We create pipe-lines and simple push-button interfaces and the dirty details of statistical analysis and data processing are black-boxed and the output is pretty graphs and plots which make for great publications and funding and that is altogether necessary.

This creates the Nintendo generation of Ph.D's, the ones who probably rightly presuppose that science is about putting samples in, pressing buttons, putting data into pipelines and getting plots and differential expression analysis, P-values, Gene/ Protein enrichment and Ontology analysis to make up a story about the list of differentially expressed Genes/Proteins which were found.

I keep hearing statements like, "How does GeneSpring calculate the P-values for differential expression? Oh, I don't care about the details of how it happens, a statement of the factoid would be enough for my presentation". Such questions make me wonder if my stress on knowing the details of what I am doing and plumbing to the depths of statistical analysis is really worth it. Am I wasting my time trying to find out how statistical tests work and where they possibly wouldn't and trying to understand them from an algebraic and geometric perspective? Should I flush myself into the Pipeline as well?

Currently, no. I've found a strange love for statistics which I never had before. Knowing that there are these formulae which take numbers and bring a certain predictability about their outputs and how linear algebra, calculus, co-ordinate geometry, probability, permutations & combinations and polynomial algebra come together to make a subject that allows us to estimate uncertainty in this random unpredictable world gives some sort of comfort. The fact that these methods could still not lead to the right decision and make wrong choices makes the whole process very organic. I don't mind being wrong about something I learned, because eventually I will find out that I was wrong and learn something that is less wrong than what I already thought I knew. The world just keeps getting better everyday and it never ends.

Of course the hypocritical human that I am, you might find yours truly one day dunking all the statistics and advertising his publications on this blog. However, not for sometime, so don't worry.

So coming back to the point, is it reasonable to restrict kids to make a particular class of device or should we let them thing of something utterly fantastic and unimaginable and then explore the currently feasible technology to find how much of their idea could be implemented into a novel device that might be far from diagnostic, but would have been a good learning experience when they would work on it. It would teach them to think outside the conventional rules and innovate and come up with alternative instead of the "standard way of doing things".

Most of the things that have been designed to make life in the laboratory easier have already been invented. They are expensive yes, but they are available in a place like the one where I work. So there is no point in having a device that can convert a manual pipette into an electronic one because in the eyes of the faculty that is re-inventing the wheel.

However, how creative is designing a sensor that measures some biological parameter? How about making an EKG for zebrafish? It is quite expensive to buy one, so the point is that you make a cheaper alternative. The question now is whether the faculty would trust such a device to make quantitative measurements that they would trust enough to send for publication. There is this mentality of believing that nothing good can come out of your own house on an off-beat, out-of-course topic especially in India as far as my experience suggests.  The compartmentalization of the sciences ensures that a biologist would never dare to take an approximation that a physicist might make with his system to gain a broader perspective. Since this is hammered into their heads when the subjects are divided into Science, Arts and Humanities at 10th (Grade), these kids then lock their perspectives into something resembling a fundamentalist outlook that defines everything in terms of their specializations and refusal to borrow ideologies.

So while we swoon at 10th grade kids abroad in the Google Science Fair who have made PCR cyclers using the Arduino with a simple PWM program, we tell ourselves, conveniently over-looking the fact that the West does not compartmentalize knowledge and lets kids do whatever they want. We worship the phoren baby geniuses and moan about how our kids are really no good at all. Truth be told, we are quite responsible for the present state and if I were to be truthful, I think (at the risk of sounding nationalistic), our kids could do a lot more. Only if we let our kids explore instead of stunting them into regimented engineering courses that are supposed to render them employable in completely unrelated fields that just needs cheap programmers to fuel code for software that operates overseas and makes money there. What our kids need are shoulders to stand upon. We should let them see ahead of what we already know so that they can do better. There is no point in hammering them into the ground and then letting them rise to a lower level that you are comfortable with because they aren't threatening your position in the hierarchy.

We as students are made to go through a culture of shaming where the student is given information that is incomplete and made to work on the problem and when they fail because of the incomplete information. The supervisor/senior/post-doc  tells them what a bunch of miserable morons they are for not having made sure of all the details and how they are going to need all the help they can get because they are truly useless when it comes to scientific methodology and how scientific methodology is attained through endless hours of toil and sacrifice at the Altar of Science.

Here's looking at you kids, the system sucks, don't be sucked into it. Rebel in your hearts, seek out what you would love to learn. The internet has broken all barriers to knowledge except for the most specialized kind with commercial, legal or national security interests. Explore, as much as you can because there is something in this world that might just excite that truly unique brain of yours and cause you to come up with something new. There is no shame in quitting something that you can't really be bothered to be interested in because frankly being mediocre at something when everyone else around you is much better can be damaging to your self-esteem unless you are the kind of person who turns it into a personal challenge to learn something new. If you aren't that fired up, then quit, it would be nice for everyone including you. Find something new to love and do.

H2G2 Mark II - the multi-dimensional guide with a secret purpose


Why the title?

The Hitchhikers Guide to the Galaxy is frequently almost nonsensical and that is what makes it appealing. Rendering linear thought impossible, the reader jumps through hyperspace and the Infinite Improbability Drive to understand the Universe as seen by Douglas Adams, and emerges a little wiser if not more confused.

An example that rings a bell in academia is the mice, who ask an all-knowing computer Deep Thought, the answer to life, universe and everything, only to be told that it is 42. Then, knowing that they've blown up taxpayer dollars, because they had not framed a proper question here, the answer fails to make sense. So they commission another experiment to build a computer to find what the Ultimate Question is, the answer to which is 42 because obviously, "What gives when you multiply 7 and 6?" lacks a ring to it. Sort of reminds you of labs that churn out data and worry about the analysis and the questions/hypothesis that lead to the story later. Written in the period, 1979-1992, they ring quite a bell in 2015.

This article introduces nothing new that you wouldn't have already realized if you are in the middle of your Ph.D, however, just like Mark II had a purpose, so does this piece, so read at your own risk

Long Story:
Once upon a time, a faculty told me that the format of a Ph.D was something that had survived all the way from Renaissance to modern-day. According to him, students start as apprentices, fulfilling the whims and fancies of their masters/supervisors. The grind, or tough-love or whatever he thought of it, was in fact necessary. Another faculty happened to tell me the same thing 3 years later rephrased as "these kids need to go through the grind because that is the only way the proper work-culture can be established".

Work-culture here implies a hierarchical structure where the kids are constantly in fear/awe of the faculty and are always corrected by them and rarely does it happen the other way round. Questions are expected from the students but only rhetorically, the student has the moral responsibility to show his work as the next big thing in the world no matter how visibly mediocre it maybe. A student cannot criticize his own work/methodology or existing frameworks of scientific discovery. The un-spoken pressure on the student is to show his work in a positive light and defend it to his death no matter how he feels about it in his own head.


Nonsense, this is killing them inside, their self-confidence goes to an all-time low, and they suffer from feelings of inadequacy and uselessness which can be debilitating. Always in a pressure to show their work in a good light takes a toll on their scientific temper and causes them to develop confirmation bias and become religious about their theories and hypotheses and causes them to irrationally become argumentative about it. Doesn’t that beat the whole point of doing a Ph.D in the first place?

What is missing here? Proponents of the current system argue that only through such a system, do they eventually become good scientists, eventually being the key word here. This system also ensures that the hierarchy does not get destroyed by chaos caused by arguments between faculty and students. It is a deeper question that needs to be addressed on why there are or should be arguments in the first place. 

It is undeniable that everything comes with an expiration date and that applies to knowledge as well. Faculty who do not revise their basics and who can’t tell that a flat line along the x-axis signifies no correlation or having the tendency to use a battery of statistical tests until the data gives the answer that they are looking for are the dangerous people here.  The picture of Science they give to their students is almost formulaic and unimaginative. The protocol is simple enough. Take two conditions, one control, one treated. Apply statistical tests (T-tests, other multivariate analysis) until some difference is found between the two and then do an enrichment analysis to find which entities (genes, proteins or metabolites) are differentially expressed and find the pathways corresponding to them. In this list of pathways find the ones that are enriched using a frequency difference test like the Chi-square or Fisher exact test. You can increase the samples and conditions and make it high-throughput and then looking at the gene ontology lists, try to guess at what is happening within the system.

They are too comfortable in their positions and while that is not necessarily a bad thing for them, it is a bad thing for their students. I’m not going to claim that it is their moral responsibility to take care of the intellectual growth of their Ph.D students but to passively damage their learning is also something that is entirely undesirable.

However I believe that if students are given all the relevant information from the beginning without overloading them with minutiae and assuming they’re individuals who are fairly systematic and sensible. It isn’t entirely impossible to believe that they can execute tasks which are considered the main-stay of scientific research, which, frankly if you consider biological sciences, are not arcane or inaccessible to a person with school level knowledge of calculus and algebra unlike some of the other sciences.

To presume apriori that they are dumb and need to be spoon-fed is a dis-service you do to them. You should probe and test them and see what they can do, if they can’t do it, then, there is no point force-feeding them. At this stage in life if they can’t be interested in something that they chose to do it is probably healthier for them to find an alternate career that they would love and enjoy. Encourage such students to leave because pushing them towards something that they clearly don’t like is a waste of time and energy for you and them. However if you insist that they need to be molded into replicas of you then you should go see a shrink about this control-freak, micro-managing condition that you seem to be developing.

What do I think we should do about it?

Encourage chaos in discussions and encourage them to question everything from the experiment design to the statistical tests and violated assumptions. Experimental designs should be criticized by having alternate designs and comparing them to see which experiment will answer the question posed while minimizing the confounding factors. When the merits and de-merits of each method are discussed an emergent thought process occurs and there is a lot more absorption when they are forced to think something through to the end rather than receive it passively as an instruction.

Statistical tests have been the same for quite some time now and their limitations are known, for instance, the inflation of the T-statistic when variance is low and that correlation should be accompanied by a P-value. Here what is important is that the students realize that the statistical test is not a means to the end. You don’t just acquire data using experiments and then sit down to apply statistical tests one by one until you get the answer you want. Rather (in another school of thought), the choice of the statistical test can more or less dictates the kind of experiment that should be performed and specify the number of replicates among other things.

For instance if you wish to find an association between two variables, one of which you can vary (like the addition of a compound) and one which you can observe (optical density). In this case correlation is the way to go to test for an association and regression will give you a model that allows you to predict the response of the system (output) given a certain quantified input of the drug.

However if you wanted to find out if the numerical difference of a particular parameter that you are observing between two groups is significantly different then you go for something like the T-test. The fact that the T-test involves a variance term means that you should have replicate observations in the groups whose significance of difference you are testing.

The above mentioned is a small example of the fact that the choice of your statistical test dictates the experiment that must be performed. To a small extent, this thought process prevents you from just gathering data without systematic planning and then trying to find patterns, patterns that could exist in random data as well. The P-values are an additional checkpoint but if you are trying to game the P-values as well, then we are talking about serious ethical issues here.   

The standard classical hypothesis testing format is designed to give you the scientist, some lee-way in making mistakes while on the process of scientific discovery. A process which itself is a little labile and prone to error, but trying to subvert the procedure just to find anything, any association or differential expression is not a healthy career move.

Apart from all of this, learn to ask questions and formulate experiments to answer them. Questions do not come out of thin air, in fact they do but when they come out of thin air they aren’t the cleverest of questions and most of the times have been worked to death by someone, somewhere in the world. To begin addressing questions of importance, one must first know everything that is known. Only after the limits of knowledge are known is when you can start asking questions that nobody else has asked before and the journey to the answer for those questions will lead to the learning process that makes scientific research worthwhile.


However it is also possible that reading too much can confuse you. When you read too much, there is an overload of information and the inability to chew on it and digest it. So space out your reading and integrate it with your work, don’t read at a stretch and work at a stretch because you could get stuck in a rut that way, use one to freshen up the perspective on the other. Write down the interesting things that you read into your lab notebook, whether they be clever methods or new ways of statistical analysis.


Sometimes, knowing too much can also be paralyzing and render you unable to work with the sheer weight of all that knowledge inside your head. In that case, stop reading and start working. The hope here is that there is something truly unique about your perspective that the rest of the world doesn’t share with regards to the solution to your Ph.D problem and that is the fresh perspective that your work needs. It’s unique because it is this conscious thing in you that has absorbed all that you ever read about the things that you liked, your hobbies, your interests and the games you play and the puzzles you’ve solved, your abilities at any of the physical sciences, music, craft or engineering. They all contribute to your unique perspective which should advance the understanding of your Ph.D problem if not, help you solve it. Above all, have fun and appreciate the good things in life.